I built an interactive tool for visualizing task progress.
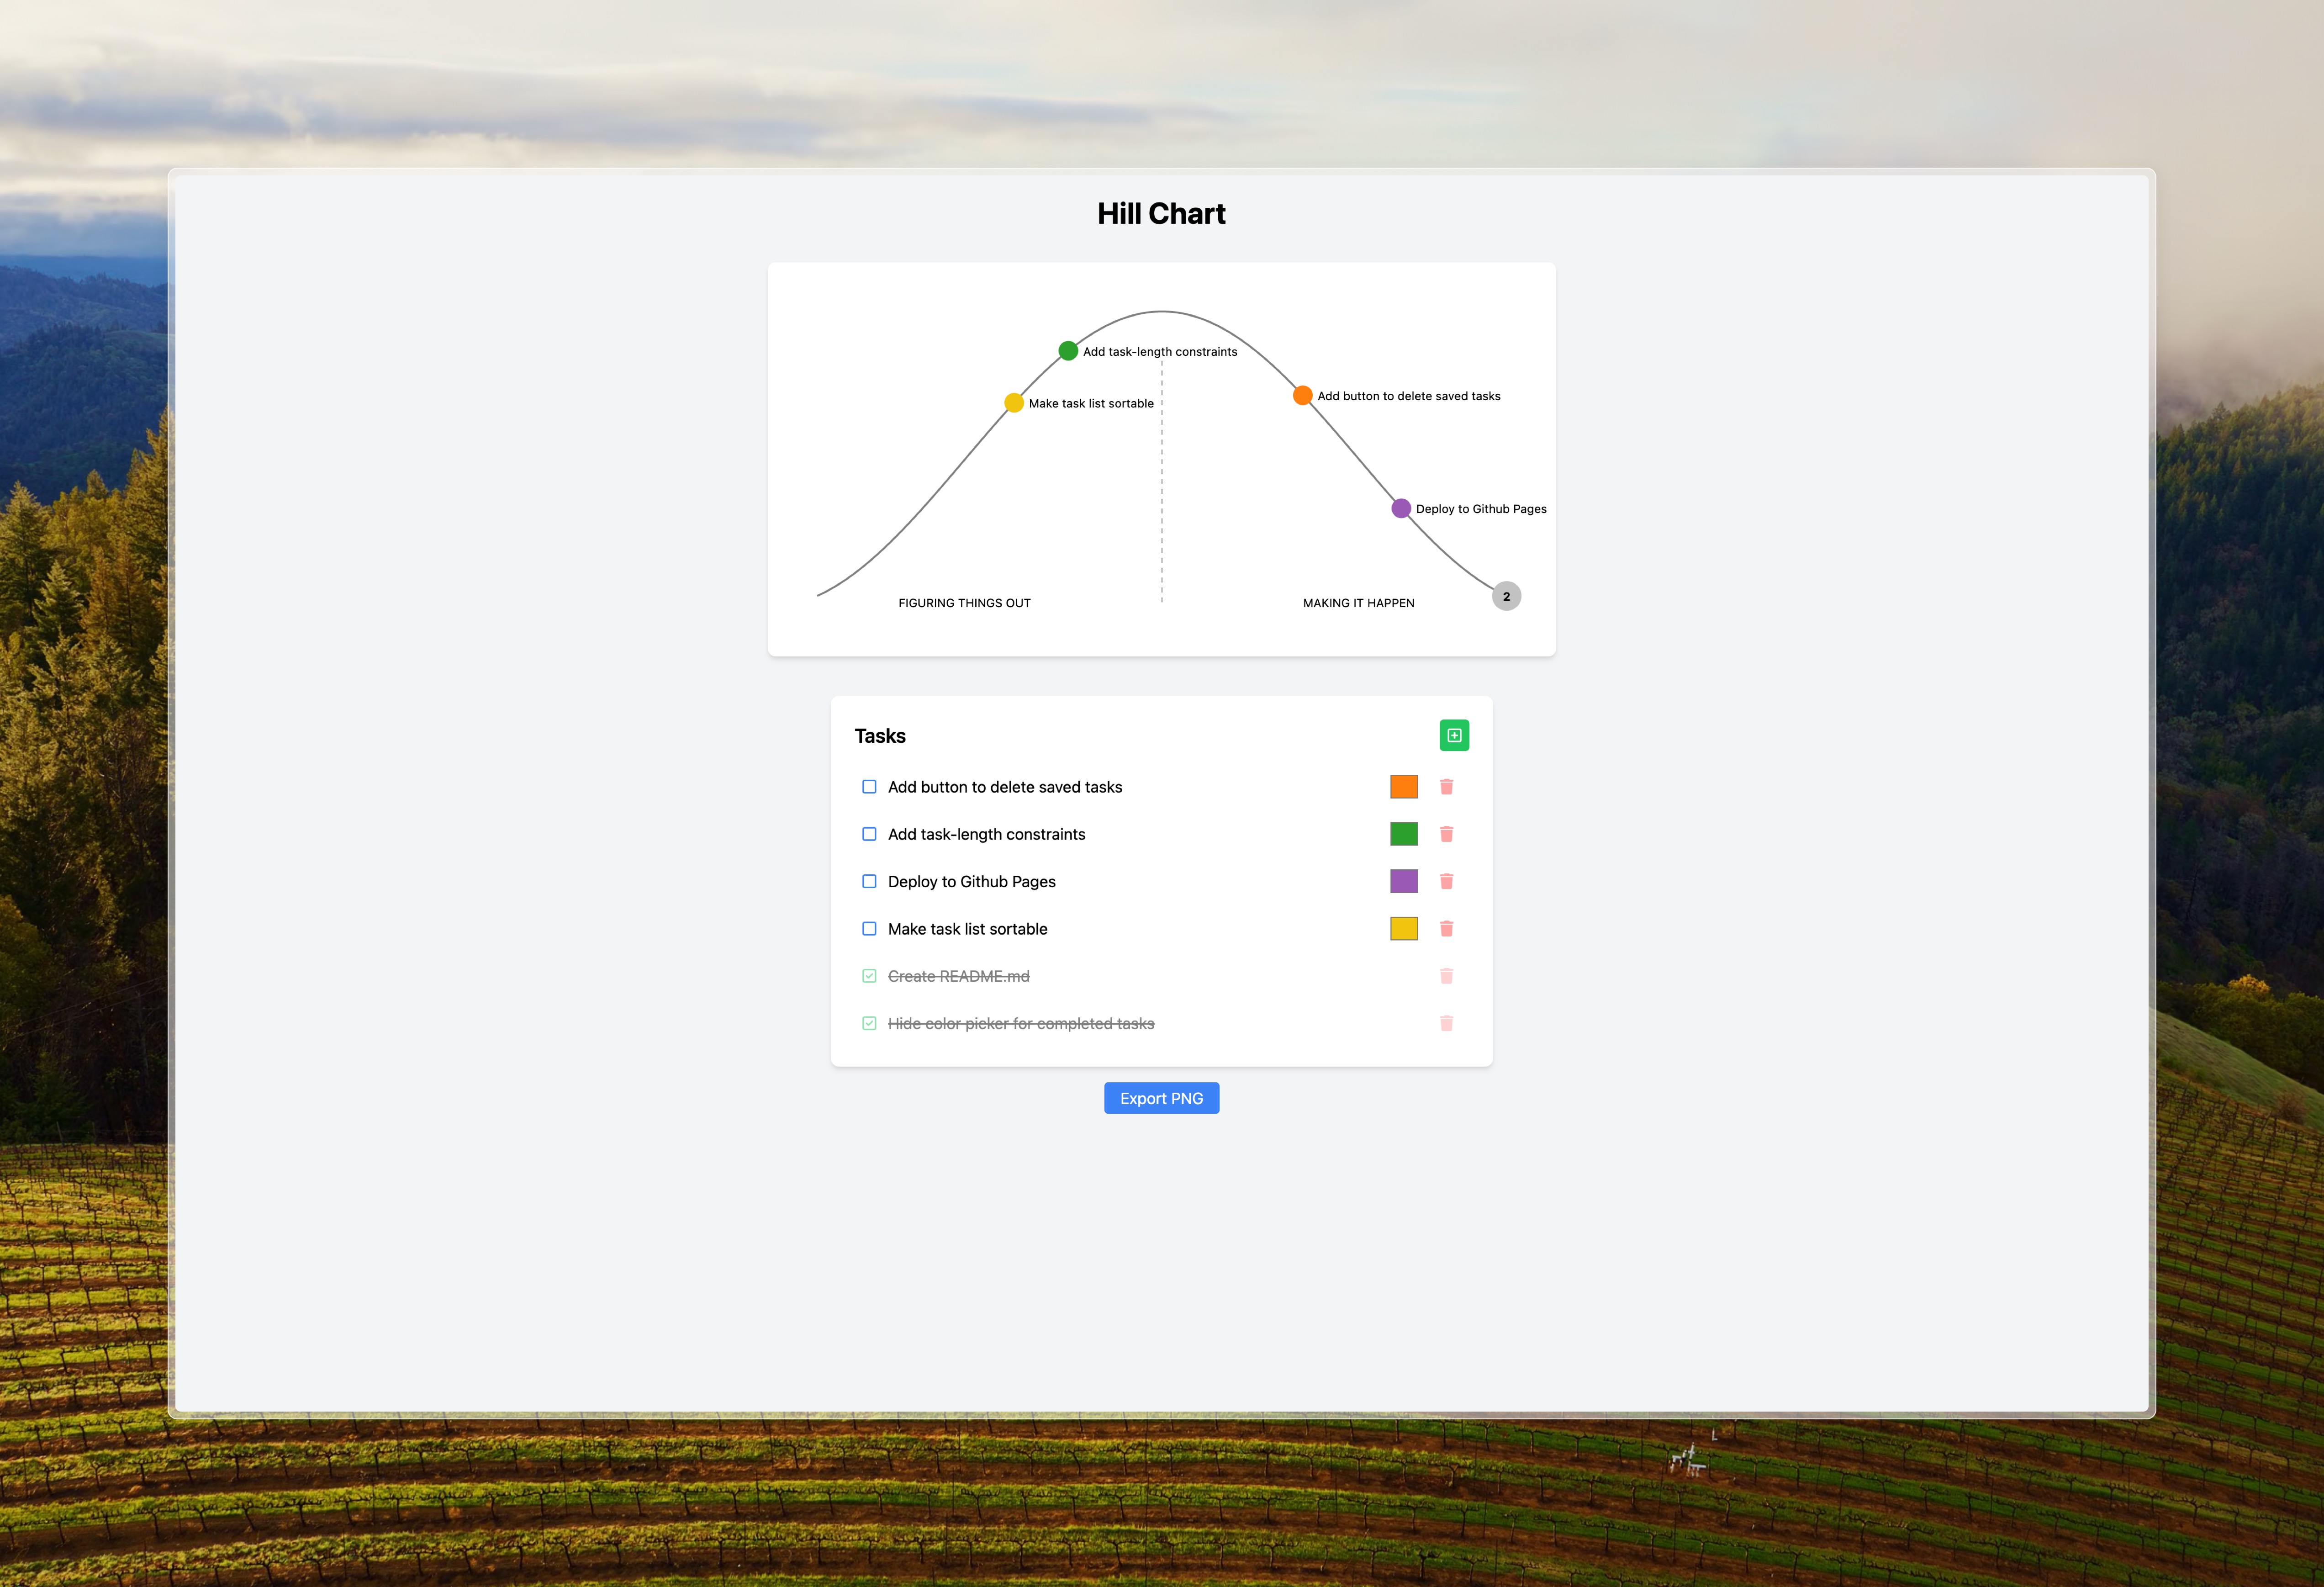
A hill chart is a visual tool for tracking tasks and projects, using the metaphor of going up and down hill to communicate the different phases of work.
Every piece of work has two phases: an uphill phase where you figure out your approach, and a downhill phase focused on execution.1
I appreciate hill charts because they embrace the fuzziness of task-based work. Unlike rigid progress metrics like “done/not done,” percentage completion, or T-shirt sizes, hill charts offer a more nuanced way to describe progress. If you export the chart each time you update it, you can also detect trends over time.
This tool runs in the browser via Github Pages and is built with plain JavaScript, d3.js, and is styled with TailwindCSS. You can explore the code by right-clicking → View Source or checking out the GitHub repo.2